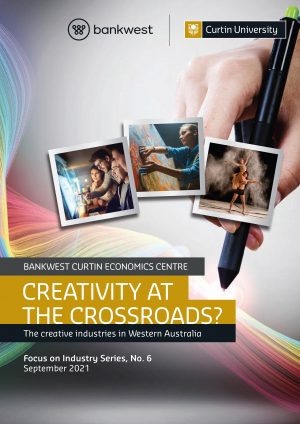
Creativity at the Crossroads? The creative industries in Western Australia
This report, the sixth in the Focus on Industry series provides an in-depth look at the Arts and Cultural sectors within the Western Australian economy.
With the boundaries of the sector defying definition by standard statistical collections, this report takes a more conceptual view of what are broadly termed ‘creative industries’ and ‘creative workers’, covering the more traditional arts through to newly emerging creative activities, such as digital design and software development for gaming.
The report explores the contributions that the creative industries sector makes to WA’s economy and society, and the strengths, opportunities and challenges faced by creative entrepreneurs and workers in this State.
Key findings:
- Our estimates suggest WA’s creative industries generate gross economic value of between $5.8 billion and $7.3 billion.
- Only 2.5 per cent of WA’s workers are employed in the creative industries sector, compared to a national share of 3.8 per cent.
- Jobs in the creative industries in Australia grew by 27.8 per cent between 2006 and 2016, compared to overall jobs growth of 17.4 per cent.
- Computer system design and related services accounted for over half of the growth in the creative industries, expanding by 57,000 jobs nationally over the last decade.
- Nationally, there has been a marked shift from print to digital platforms as mediums for accessing creative output.
- Creatively intensive industries have seen above average rates of employment growth – professional photographic services leading with an 83 per cent increase.
- Nationally, employment in creative occupations grew at almost twice the pace of overall employment growth.
- Perth has on average 1.6 times as many workers in the creative arts industry as the average of Australia.
- In WA, workers in the creative occupations are twice as likely to hold a university degree or higher qualification than all employed workers.
- ICT has the smallest proportion of women, at less than 20 per cent, compared to other sub-groups which have an almost equal distribution between men and women.
- Over a third of art and cultural workers are self-employed, compared to the WA norm of less than 10 per cent.
- The average annual incomes of workers in the traditional arts industries is around $20,000 below the population average.
- The income gap between men and women seems to be negligible in the more traditional arts industries.
- Around eight in ten West Australians attend at least one cultural venue or event each year, with two thirds attending live events.
- The majority of Western Australians report that arts and culture has a large impact on their health and wellbeing, creative thinking, and ability to express themselves.
- Attendance at performing arts has a significant association with better mental health. Relative to the average index of mental health, the results show that attendance at performing arts improves mental health by about 1.5%.
- In recent years, WA government funding in culture and the arts has been higher than the national average on a per capital basis.
- Region wise, apart from the CBD, Fremantle has the highest overall related density on average for all creative arts categories, followed by Melville, Stirling, Cottesloe, Claremont and Joondalup.


