


BCEC Monthly Labour Market Update – September 2023
— Labour market weakens, but headline unemployment rate falls. —
— Exodus of males from the labour force as male participation rate falls 0.7ppt to 71.0 per cent; female participation rate returns to 62.7 per cent record high. —
— Signs that job vacancies have started to moderate, but labour market conditions remain very tight. —
All eyes on Wednesday’s inflation figures
While the headline national unemployment figure fell from 3.7 per cent to 3.6 per cent, on balance the September 2023 figures pointed to a weakening in the labour market. The fall in the unemployment rate can be primarily attributed to a sharp drop in the male participation rate.
Employment did increase, but barely, and by well below the rate required to keep unemployment from rising in the longer term. Moreover, there was a substantial fall in the number of full-time jobs, offset by a slightly larger rise in part-time jobs.
Other signs of weakening include falling job vacancies, notably in the key ABS quarterly series (down 8.9 per cent for August), and a 0.5 per cent drop in workers’
average monthly hours worked. However, vacancies remain at very high levels by historical standards.
Add in the old adage of never reading too much into a single month’s figures, and the conflicting signals from the September Labour Force Survey won’t offer any extra breathing space for the RBA on the need for a further interest rate rise.
That will all come down to the September quarter inflation figure, due out on Wednesday.
For the RBA, the critical question is whether the state of the labour market will be adding to or subtracting from inflationary pressures.
The most recent data available suggest nominal wage growth is already running above the upper bound of the RBA’s 2-3 per cent inflation target band, and probably accelerating.
The number of unemployed persons per job vacancy has increased slightly over the course of this year but that ratio remains near historical lows, adding to workers’ bargaining power.
Some reporting suggested September’s fall in the participation rate reflected people giving up on looking for work. We feel that’s a misreading of the current conditions.
Flows data for September show an increase in the rate at which unemployed people found work last month, and the notable increase in exits was in the form of full-time workers leaving the labour force.
We noted last month that the high male participation rate was counter to long-term trends and might not be sustainable. On the same basis, we suspect the drop in male participation in September represents something of a ‘correction’ as families and workers pursue their preferred working arrangements, rather than a change in underlying labour market conditions.
The new RBA Governor, Michele Bullock, recently expressed concerns that the series of external supplyside shocks may be fuelling inflationary expectations.
The ongoing strength of the labour market will mean those expectations are more likely to translate into nominal wage pressure, making the RBA’s goal of bringing inflation under 3 per cent more difficult.
Wednesday’s CPI figure will need to provide evidence that inflation is continuing to fall to save mortgage holders from a further rate rise in November.
The labour market ‘marriage premium’
Between the release of key aggregates from the monthly Labour Force Survey, the Australian Bureau of Statistics publishes more detailed results in February, May, August and November.
The recently released August 2023 estimates provide deeper insights into developments in the labour market, such as changes in employment by industry and occupation, and labour force outcomes for specific demographic groups.
One such breakdown is by ‘social marital status’, which focuses on labour market outcomes for those in a married or de facto cohabiting relationship (‘married’ for short).
The female participation rate hit a record high of 62.7 in May and September this year, while the male participation rate (71.0 per cent in September) has been following a long-term downward trend.
Data by marital status reveal what’s behind these long run trends.
When the current series began in 1978, the male participation rate was close to 80 per cent, way above the female participation rate of around 45 per cent (see Figure 1).
Participation was around 10ppt higher for married men (82%) than for single men (72%).
Both far exceeded the participation rates for females, which were 47 per cent for single women and 41 per cent for married women.
So while married women had the lowest participation rates in the late 1970s, the subsequent rise in their participation has been the most profound change, resulting in the record female participation rates seen today.
From just over 40 per cent, married women’s participation increased to pass 50 per cent from around 1990 and to overtake that of single women at about the same time.
At over 66 per cent today, it is on par with the rate for single men, and around 10ppt higher than for single women.
Over the full series, the participation rate for married women has increased by almost 25ppt, compared to 11ppt for single women.
Meanwhile, participation of married and non-married men have both trended downwards (by about 9ppt and 5ppt, respectively).
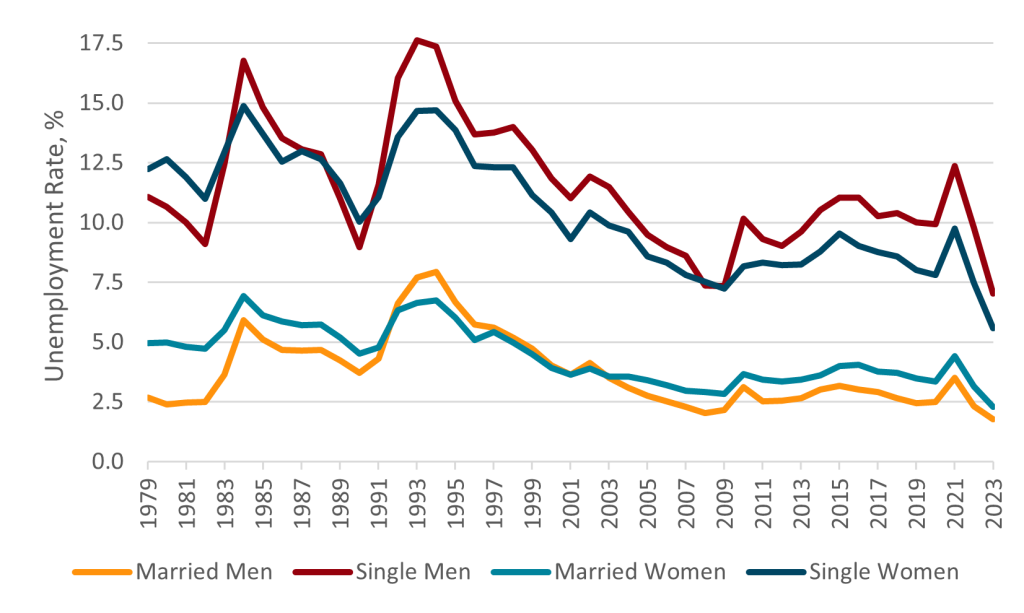
While the story of increasing participation among married women will be familiar to some, less well known is the differences in unemployment rates by marital status.
Over the 45 years of the current Labour Force Survey the unemployment rate for married men and women has been half or lower than that for their non-married counterparts.
While the unemployment rate for August 2023 stood at 3.7 per cent in non-seasonally adjusted terms, it was just 1.9 per cent for married persons compared to 6.6 per cent for non-married persons.
Both married men (1.6%) and married women (2.3%) continue to have far lower rates of unemployment (Figure 2).
Since 2000, married men have tended to have only marginally lower unemployment rates than married women, whereas the gap was more marked in the late 1970’s and early 1980’s.
This is a significant outcome given the substantial increase in participation of those married women.
In contrast, single men have had consistently higher unemployment rates than single women this century.
All this has important implications for income distribution between households.
Over the course of this century, single persons’ share of the labour force has remained fairly stable at around 38 per cent.
Rising female participation within couples and their lower unemployment rates will have contributed to a growing number of dual-earner households and higher relative incomes for couple households.
Figure 1 Participation rate, by marital status and gender, Australia
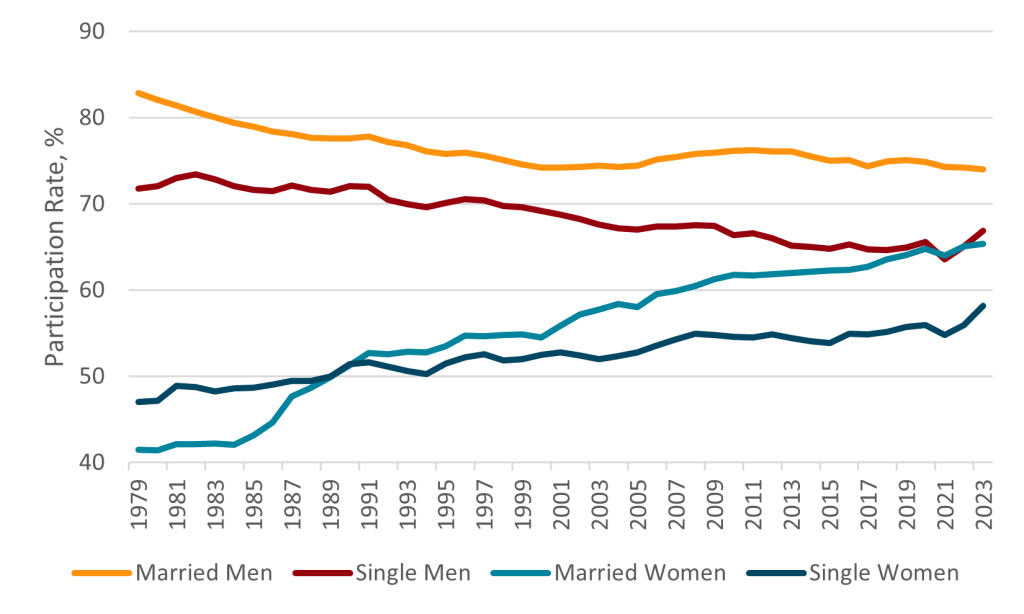
Figure 2: Unemployment rate, by marital status and gender, Australia
Notes: Data is an annual average. Source: BANKWEST CURTIN ECONOMICS CENTRE |
Australian Bureau of Statistics Cat No 6291.0.55.003 Table 1.