The facts on Australian housing affordability

Housing affordability, high house prices and rents are attracting plenty of media attention right now. The latest figures on house prices, mortgages, number of first time buyers and so on are dissected by journalists and commentators as if this is an issue of recent origin. In fact what we have here is a long-term structural problem that has been neglected for decades.
Back in 1982, the ABS Survey of Income and Housing revealed that 168,000 or 10% of home buyers spent more than 30% of their gross household income on housing costs. Nearly 30 years later in 2011 these numbers had soared to 640,000, equivalent to 21% of all home buyers.
The trends in housing cost burdens reflect rising real house prices. The history of house prices over this timeframe is one of booms in which real house prices escalate to higher levels than they peaked in the previous boom. Periods of house price stability punctuate these booms, and give household incomes some breathing space in which to catch up.
But at each peak in house prices, household incomes have fallen further behind. According to the same ABS data source, households in 1990 on average valued their homes at a multiple that was four times their average household income. By 2011 this multiple had climbed to nearly six times average household income.
A generational threat
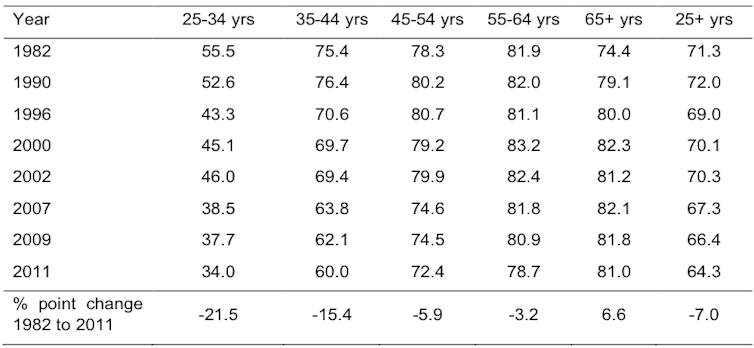
It is therefore not surprising to find that young first time buyers are finding it increasingly difficult to purchase a home. As our first table shows, on a person basis the rate of home ownership in the prime 25 – 34 year age group has slumped from 56% in 1982 to only 34% in 2011. Delayed entry into home ownership is a factor, but it turns out that these declines have set in across all but the post-retirement age group. The “Australian dream” of home ownership is under threat.
Home ownership rate 1982-2011, in percentage terms

How have we reached this position? To be sure population growth, low interest rates, deregulation of mortgage markets and rising real incomes have helped fuel the demand for housing, and pushed up real house prices. But there are deep seated structural problems that contribute to an inflationary bias in land and property markets.
Fiscal concessions in the form of capital gains and land tax exemptions to home owners, negative gearing and concessionary capital gains tax for “mum and dad” investors, and asset test concessions to home owner retirees offer powerful incentives to accumulate wealth in housing assets. As a result, the supply side problems are not so much about a shortage of housing, but an inefficient distribution of the stock of housing.
According to the 2010 Household, Income and Labour Dynamics in Australia Survey, roughly 1 in 6 Australian households own two or more properties, and for 30% of these households the second property is a holiday home. Growing numbers of ageing “empty nester” households are deterred from downsizing and releasing housing equity by stamp duty, the taxation of alternative investments of the equity released, and the lack of suitable housing opportunities in the communities they would like to stay in.
Meanwhile according to the latest census more than 100,000 Australians are homeless, and many more than this are struggling to meet housing payments.
The supply issue
Back in the early 1980s these fiscal drivers did not matter so much, because there were ample greenfield sites on which new housing could be constructed. These sites still offered reasonable access to amenities and jobs. But such opportunities are drying up, and state governments have introduced curbs on urban expansion, as well as developer charges and fees that have increased the costs of construction on the urban fringe.
Adding to supply side problems are planning controls that impede higher density development in middle ring suburbs, as “insider” home owners understandably seek to protect the “leafy character” of their communities.
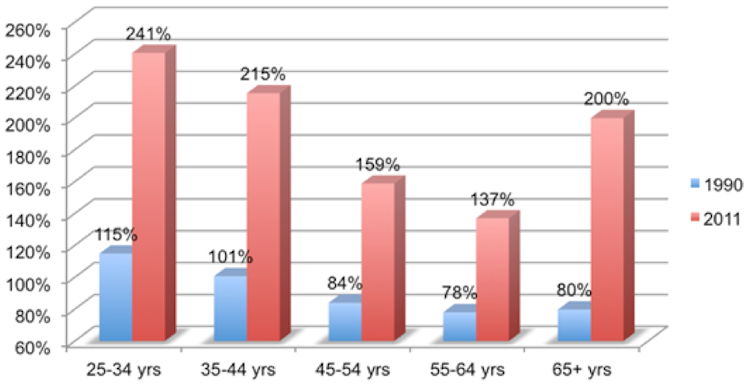
We are left with a problem that has wider ramifications because it has created a housing system saddled with growing indebtedness. In the 21 years illustrated in the chart below the average mortgage debt has soared relative to the average household incomes of mortgagors in all age groups.
Mean mortgage debt to income ratio

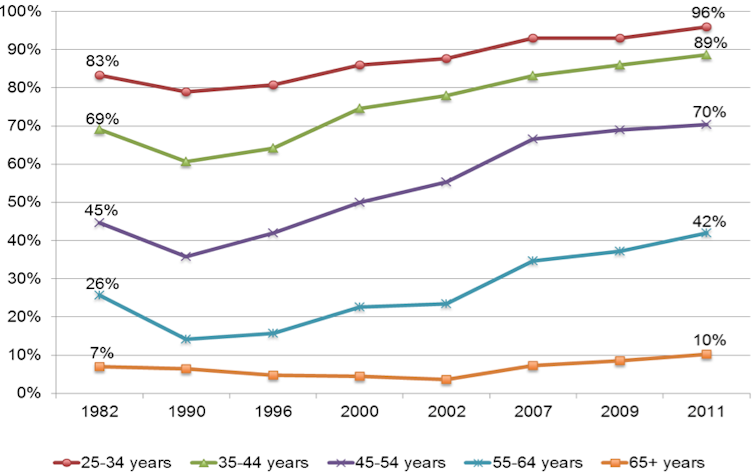
Moreover, the proportion of home owners with outstanding mortgage debt has increased, especially in the 55–64 year cohort that is typically approaching retirement (see chart below). Interest rates were much higher back in 1990 and so household incomes in 2011 can comfortably service loans that are larger relative to household income.
Percentage of home owners with a mortgage debt

Nevertheless repayment risks and investment risks (house values falling short of outstanding mortgage debt) loom more prominently, and for a larger number of precariously positioned households. These risks could test the resilience of local economies and the national economy.
The Australian housing system weathered the global financial crisis much better than did many of its counterparts in the developed world.
Does this suggest a resilience that we can bank on in the future? Federal and state governments might be well advised to introduce structural reforms to housing finance that strengthen that resilience.
Gavin Wood, Professor of Housing, RMIT University and Rachel Ong, Principal Research Fellow, Bankwest Curtin Economics Centre, Curtin University
This article was originally published on The Conversation. Read the original article.


