

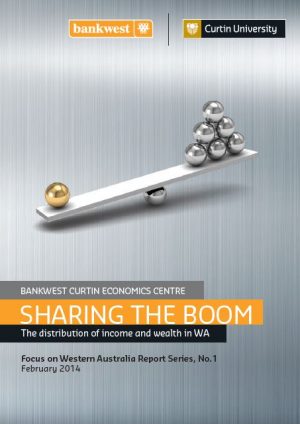
Sharing the Boom in Western Australia…but how equally?
Western Australians have seen clear benefits from the mining boom – but not all have benefitted equally, with the State’s lowest income households falling behind the rest of the WA population.
The Bankwest Curtin Economics Centre (BCEC) at Curtin University today released a major report on Sharing the Boom: the distribution of income and wealth in WA, which analyses the impact the resource boom has had on people throughout the State.
Professor Alan Duncan, Director of the Bankwest Curtin Economics Centre, explained the benefits of the boom had improved the circumstances of many households in WA, but that there had been a rise in both income and wealth inequality over the period.
“The gap between the richest and poorest households in WA rose consistently since the acceleration of the WA boom in 2003-04 to its peak in 2009-10, and at a greater rate than for the rest of Australia,” Professor Duncan said.
“The highest income households are getting richer and the median income households are also earning substantially more, but the lowest income households in the State are falling further behind, increasing the gap between the poorest families and everyone else.”
The richest 10 per cent of households in WA had around 3.8 times the income of the poorest 10 per cent of households in the State in 2003-04. This climbed to 4.8 times in 2009-10 before falling slightly to 4.5 in 2011-12.
“This report looks at inequality from a relative standpoint. There have been real gains among the lowest income households, but the report shows they haven’t been able to share in the benefits of the boom to the same degree as higher earners, financially at least,” Professor Duncan said.
The situation for the lowest income households hasn’t been helped by the fact the overall prices in WA – as measured by CPI – ran consistently ahead of those for the rest of Australia for much of the heart of the resources boom, especially for those in regional WA.
WA households are among the wealthiest in the country, and Perth ranks third across the nation for mean household net worth, averaging just over $800,000 per household. The average net worth for regional areas in WA reached $715,000 in 2011-12 – ranking first among all state and territory regions in Australia.
“Household net wealth in WA has increased by more than 70 per cent in real terms since 2003, adding at least $268 billion to the State’s total wealth stock,” Professor Duncan said.
The wealthiest 20 per cent of households in WA own at least 62 per cent of the State’s total household net wealth assets, with the top 40 per cent holding 83 per cent.
“Most of these gains are concentrated on the wealthiest households in WA, however, with 65 per cent of the extra net wealth generated over the course of the boom accruing to the top wealth quintile,” Professor Duncan added.
“This has led to a marginal rise in wealth inequality in the State.”
The report also showed that high income households in WA were twice as likely to be headed by a ‘tradie’ as those in the rest of Australia.
“One fifth of the highest income households in WA in 2011-12 are headed by a person that holds a trade certification as their highest level of education, compared with only 16 per cent in the rest of Australia,” Professor Duncan said.
“This reflects the commonly held belief that ‘tradies’ are among those who have benefited from the boom.”
Other key findings in the Sharing the Boom report include:
WA residents are earning more, but there are gaps across regions
- WA disposable incomes have outpaced the national average by a margin of nine per cent over the last five years.
- The Pilbara stands out in WA – 41.7 per cent of residents have an individual gross weekly income of over $2,000. This compares to an average of 11.1 per cent across WA, including the Perth metropolitan area.
- The Goldfields-Esperance region has the second highest proportion of those earning more than $2,000 each week. This region also has over one quarter of individuals with incomes above $1,500 per week.
- At the same time, there are higher concentrations in regional WA where individuals have incomes below $300 per week, mainly in sparsely populated areas and among Indigenous communities.
A dollar doesn’t go as far in the Pilbara, Kimberley and the Gascoyne as in Perth
- Prices in the regions have inflated relative to Perth.
- Generally the costs of everything in the Pilbara are much higher than in Perth – housing is about 40 per cent more expensive, health costs are 30 per cent higher and other expenses such as food, transportation, tobacco and alcohol, durables, recreation, education and clothing are about 10 per cent more costly when compared to similar items in Perth.
Perth residents rank third for mean net worth
- Median household net worth for Perth residents increased by 37 per cent in real terms to just over $464,000 in 2011-12, which ranks fourth across all states and territories in Australia.
- Perth ranks third across the nation for mean net worth, averaging just over $800,000 per household. The average net worth for regional areas in WA reached $715,000 in 2011-12.
- Ownership of superannuation assets for Perth households currently surpasses the national average (83 per cent compared with 79.7 per cent), however it is lower than Brisbane and Melbourne.
- Fewer households in WA own share assets than at the start of the boom, but more Perth households now own other property (over 21 per cent) than anywhere else in the country.
- The median value of household net wealth from other property rose $160k in WA over the course of the boom – to $450k for Perth households and $400k for families in regional WA.
- This could indicate an increasing use of property for investment, or second home ownership, or that more families choose to retain rather than sell their properties when relocating.
‘Tradie’-headed households are holding more wealth
- In WA, household heads holding a trade certificate have a larger and increasing presence in the top 20 per cent of high income earning households over time.
- Eighteen per cent of high income households in WA are headed by those who are employed in the trade occupations, compared with only 9 per cent of high income households in the rest of Australia.
But even with the extra money, WA residents don’t all own homes
- Housing costs in WA increased at a rate consistently above the national average for an extended period from 2003-04, commonly by an extra five percentage points more than the rest of Australia annually.
- Figures show that high income households in WA are more likely to be owners with a mortgage (58 per cent) rather than mortgage free, compared to high income households in the rest of Australia (53 per cent).
- The proportion of renters in WA high income households has increased slightly, whereas outright home ownership among high income earners decreased across the boom period.
Professor Duncan explained that overall, the report showed WA had stayed strong during the course of an economic downturn that weakened most of the world’s economies.
“The boom has benefitted the majority of WA households, with rising employment opportunities and substantial increases in real incomes and household net wealth,” Professor Duncan said.
“But income growth across the boom period has created a greater gap between high and low income households, both in terms of income and wealth.
“Low income families in WA have failed to share the benefits of the boom at the same rate as higher income households, which emphasises the need to support those people on low income who may not benefit from the same standard of living increases experienced by the rest of the population.”
Further Information
 Sharing the Boom
Along with its relaxed lifestyle and beautiful beaches, Western Australia is arguably most recognised for the riches to be found under its red earth and clear blue oceans. International demand for iron ore, and the strength of China as a... Read article
Sharing the Boom
Along with its relaxed lifestyle and beautiful beaches, Western Australia is arguably most recognised for the riches to be found under its red earth and clear blue oceans. International demand for iron ore, and the strength of China as a... Read article