

Big divide between haves and have-nots in Australian education

Rebecca Cassells, Deputy Director
Michael Dockery, Principal Research Fellow
Joanne Peckitt, Communication and Stakeholder Engagement Coordinator
— Most disadvantaged children half as likely to be attending pre-school —
— Indigenous students still under-represented in Australian universities —
— School funding well-targeted to need —
The most disadvantaged 10 per cent of children in the Australian Capital Territory are on par with the most advantaged 10 per cent living in the Northern Territory, according to a new Bankwest Curtin Economics Centre (BCEC) report that reveals the extent of education inequality across Australia.
The BCEC’s latest report, Educate Australia Fair?: Education Inequality in Australia, examines the extent of educational disadvantage across and within Australia’s states and territories and among vulnerable groups.
BCEC Director and report author Professor Alan Duncan said the divide between the most and least disadvantaged areas offered a sobering reminder of the level of inequality that still exists in our society.
“Compared to the most advantaged localities in Australia, children in those fifty areas at greatest educational disadvantage are, on average, half as likely to be enrolled in pre-school at age four, half as likely to attend pre-school for 15 hours or more, and seven times as likely to be vulnerable on two or more developmental domains in their first year of schooling,” Professor Duncan said.
“Our index shows the most disadvantaged areas are located in very remote regions of Australia, spanning the Northern Territory, South Australia and Western Australia. But pockets of disadvantage are also evident on the fringes of our state capital cities.
“Our findings also show that the most disadvantaged students are averaging half the NAPLAN scores in reading, writing and numeracy of those in the least disadvantaged areas.”
The report also found that government funding appeared to be reasonably well-targeted relative to need, with those in the most disadvantaged areas receiving greater amounts of funding.
“Schools in areas of greatest educational disadvantage receive income of $24,100 per student, some 50 per cent higher than the average of $16,400 for the top 50 areas,” Professor Duncan said.
“This demonstrates the need for education policies to go beyond funding reform, and address the complex barriers that exist in delivering education to our most vulnerable children.”
Report co-author and BCEC Principal Research Fellow Associate Professor Rebecca Cassells said early participation in education played an important role in outcomes later in life.
“More children are attending pre-school than ever before, however, one in five enrolled children are not accessing at least 15 hours of pre-school each week in their year before starting school,” Associate Professor Cassells said.
“This finding is made more concerning when we see that one in three children living in the lowest SES areas are likely to be developmentally vulnerable in their first year of school, and this likelihood increases by threefold if the child is living in a very remote area.
“At the other end of schooling, we’re seeing that nearly half of young people (49.4 per cent) in the most disadvantaged areas are not studying until they are 17 years old, compared with just 2.5 per cent in the least disadvantaged areas.
“Student attendance rates are also problematic for a number of equity groups and at certain points during the education life-cycle. The gap in student attendance rates between Indigenous and non-Indigenous students remains constant throughout primary school, averaging around eight percentage points, but deteriorates rapidly once high school commences, reaching 15 percentage points by Year 10.
“The transition from primary school to secondary school is often challenging for young people, but clearly more so for Indigenous students.”
Report co-author and BCEC Principal Research Fellow Associate Professor Michael Dockery said the research found a clear link between the level of parent and child education attainment.
“Almost two-thirds of Australians whose parents achieved a university qualification have also gone on to achieve a tertiary level qualification. This compares with those whose parents achieved year 10 or below, where only 21 per cent were able to gain a tertiary qualification,” Associate Professor Dockery said.
“In regards to equity groups, we found the greatest expansion in university enrolments has been by students with a disability and Indigenous Australians, at 171.2 per cent and 92.3 per cent growth respectively between 2001 and 2015.
“However, Indigenous students remain underrepresented in universities in each state and territory and only made up 1.6 per cent of enrolled domestic students in 2015.”
About the BCEC Educational Disadvantage Index
The key purpose behind the index is to uncover the extent of inequality in educational opportunities by locality, to reveal hotspots of high or low education outcomes, and to support the development of targeted and effective policy initiatives that improve our children’s school experience and educational achievements.
The index includes a number of indicators related to access, performance and outcomes, with data derived from the AEDC, ACARA, NAPLAN, Census and National Early Childhood Education and Care Collection.
The Index is used to map areas of relative advantage and disadvantage, profile areas of high and low disadvantage and to assess the key drivers of educational disadvantage. Individual maps of states and capital cities along with top and bottom ten areas within each state are available within the report.
Key findings from the BCEC Educational Disadvantage Index include:
- Australia
- Children living in the least disadvantaged areas will achieve on average double the score in reading, writing and numeracy tests than those living in the most disadvantaged areas.
- The most disadvantaged 10 per cent of children in the ACT are no more disadvantaged than the most advantaged 10 per cent of children in the NT.
- New South Wales
- One in five children in the most disadvantaged areas in NSW are vulnerable on two or more developmental domains in their first year of school compared to only 5.5 per cent of children in the least disadvantaged areas in the State.
- Victoria
- Victoria has generally far fewer areas with significant educational disadvantage compared to other states and territories, however, a number of clusters of disadvantage are evident within its capital, Melbourne.
- Among the ten most disadvantaged areas in Victoria, the proportion of children that are developmentally vulnerable in two or more domains is double that of the national average.
- The bottom ten areas have a much higher proportion of children from a non-English speaking background than the national average.
- Queensland
- A ribbon of advantaged areas is evident along the Brisbane River extending from Bellbowrie through to Eagle Farm.
- Wacol and Riverview in Brisbane’s west stand out as problem areas, as well as the Logan-Beaudesert region south of the city.
- Queensland’s most disadvantaged areas are doing better than average on a number of indicators, especially universal access to pre-school, suggesting this investment in early childhood will begin to pay off in years to come.
- South Australia
- The remote regions of South Australia, including Outback, Coober Pedy and APY Lands while sparsely populated also have high levels of relative educational disadvantage.
- Almost 60 per cent of children in the most disadvantaged areas are attending pre-school for less than 15 hours each week, compared to around 33 per cent nationally.
- Western Australia
- Only 40 per cent of children in the most disadvantaged areas in WA are attending pre-school for 15 or more hours on average, compared to almost 70 per cent nationally.
- One in two children assessed as developmentally vulnerable on one or more domain and more than one in three developmentally vulnerable in two or more domains.
- School funding per student is higher than the national average in these areas, reflecting the relative disadvantage and higher cost of delivering services to remote areas. Funding ranges from $19,707 per student in Carnarvon up to $54,077 per student in East Pilbara. This compares to the national average of $14,346 per student.
- The lack of access to services in many of the disadvantaged areas across Western Australia is evident, with a very high proportion of children living in households that do not have access to the internet – 46.7 per cent on average.
- Tasmania
- Children living in the most disadvantaged areas in Tasmania have double the national rate of children vulnerable in their first year of school on one or more domains.
- Access to the internet and youth engagement in either earning or learning are problem areas for Tasmania.
- Northern Territory
- The bottom ten areas in the Northern Territory are among the most disadvantaged areas in Australia, with extremely high levels of developmental vulnerability and school non-attendance, and very low performance in literacy and numeracy. In most instances, these rates of disadvantage are double, triple and up to four times the national average.
- Two-thirds of children in the bottom ten areas in the Northern Territory are developmentally vulnerable on one or more domain, and one in two are vulnerable in two or more domains.
- Australian Capital Territory
- Australian Capital Territory is consistently characterised as a location with relatively little disadvantage.
- A number of similarities can be seen between the top and bottom ten areas within the ACT, including similar proportions of children access pre-school.
- Children in the bottom ten areas in the ACT are more likely to be developmentally vulnerable and more likely to have higher levels of school non-attendance.
Additional report key findings include:
- One in five children enrolled in pre-school are not accessing 15+ hours of pre-school each week in their year before formal schooling.
- Boys are twice as likely as girls to be developmentally vulnerable.
- Indigenous children are twice as likely as non-Indigenous children to be developmentally vulnerable on one or more domain and three times as likely when assessed on two or more domains.
- One in three children living in the lowest socio-economic areas across Australia experience one or more developmental vulnerabilities in their first year of schooling.
- School enrolment rates for Indigenous children has been increasing over time from 84.1 per cent in 2008 to 97.8 per cent in 2014.
- The Northern Territory has the widest gap in attendance rates between Indigenous and non-Indigenous students in both primary and secondary school – 20.2 and 28.4 percentage points respectively.
- The proportion of students meeting the minimum standard in reading increased by 19 percentage points for non-Indigenous children and 14.3 percentage points for Indigenous children in Queensland between 2008 and 2016.
- Only 35 per cent of Indigenous students in the Northern Territory continue through to Year 12, compared with 92.4 per cent in the ACT.
- Indigenous Australians are around 40 per cent less likely to complete Year 12.
- Students with a disability is the equity group that has seen the greatest expansion in university enrolment figures, followed by Indigenous students.
- 98 per cent of children in Year 3, whose parent achieved a bachelor degree or higher were reading at or above the national minimum standard, compared to 86 per cent of children whose parents were educated to Year 11 or below.
- Low SES students made up only 9.4 per cent of domestic enrolments in the Group of Eight universities, compared to 16.6 per cent across other universities.
- Almost two-thirds of Australians whose parents achieved a university qualification have also achieved a tertiary level qualification. This compares with those whose parents achieved year 10 or below, where 21 per cent were able to gain a tertiary qualification.
Drivers of Education Disadvantage
- The most disadvantaged areas are also more likely to have children attending government schools than independent schools, but almost equally as likely to be attending a Catholic school when compared to those in the least disadvantaged areas.
- Over four times the share of children are assessed as vulnerable on at least one developmental domain in those 50 areas at the greatest educational disadvantage (49.7 per cent) compared with children in the 50 least disadvantage areas (11.9 per cent). This rises to a seven-fold difference when looking at the share of children vulnerable on at least two domains (33.5 per cent compared with 4.8 per cent).
- The formula for disbursement of financial resources does appear to be functioning according to needs-based criteria, with those schools in areas of greatest educational disadvantage receiving a gross income $24,069 per student, some 50 per cent higher than the average of $16,396 for the top 50 areas.
- About 44.5 per cent of families in the lowest ranked areas, almost entirely living in very remote areas, have no internet access.
- Nearly half of young people (49.4 per cent) in the lowest ranked areas are not studying at age 17, compared with 2.5 per cent in areas of least educational disadvantage.
- About half of young people (49.7 per cent) in the most disadvantaged areas are neither earning nor learning. This compares with only 12.8 per cent of young people who are neither working nor studying.
Further Information
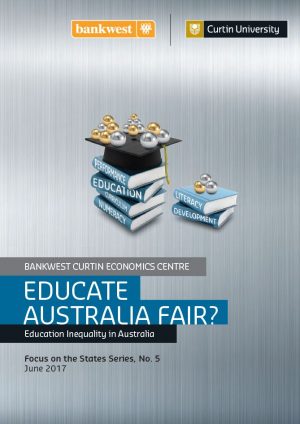 Educate Australia Fair?
When we think of a ‘good society’ – a society that is fair and just – one of the defining characteristics is likely to be that all individuals have equal opportunity to realise their potential, irrespective of the circumstances into... Read article
Educate Australia Fair?
When we think of a ‘good society’ – a society that is fair and just – one of the defining characteristics is likely to be that all individuals have equal opportunity to realise their potential, irrespective of the circumstances into... Read article